Feeds:
Posts
Comments

Posts Tagged ‘disorder’

copd_smoking_nat_genet_lung_function_gwas_wain

We – as a group – carried out the largest genome-wide association study to identify genetic variants that are associated with decreased lung function and increased risk of chronic obstructive pulmonary disease. We hope that our findings will ultimately lead to the identification of effective drug targets for COPD. Image source: University of Leicester

I remember reading somewhere that ‘if you get asked the same question three times, then write a blog post about it’. That’s what I’ve been doing so far, and the purpose of this blog post is the same: to try and provide an answer to a commonly asked question. (Important note: my answers are in no way authoritative and only meant for interested non-scientists)

As a ‘Genetic Epidemiologist’, I constantly get asked what I do and what my (replace ‘my’ with ‘our’, as I do everything within a team) research can lead to. Please see my previous post ‘Searching for “Breathtaking” genes. Literally!‘ and My Research page for short answers to these questions. In tandem to these, I am constantly asked ‘why we can’t find a ‘cure’ for (noncommunicable) diseases that affect/will affect most of us such as obesity, diabetes, cancer, COPD – although there are many scientific advancements?’. I looked around for a straight forward example, but couldn’t find one (probably didn’t look hard enough!). So I decided to write my own.

I will first try and put the question into context: We do have ‘therapies’ and ‘preventive measures’ for most diseases and sometimes making that distinction from ‘a cure’ answers their question. For example, coronary heart disease (CHD) is a major cause of death both in the UK and worldwide (see NHS page for details) but we know how we can prevent many CHD cases (e.g. lowering cholesterol, stopping smoking, regular exercise) and treat CHD patients (e.g. statins, aspirin, ACE inhibitors). However, there are currently there are no ‘cures’ for CHD. So once a person is diagnosed with CHD, it is currently impossible to cure them from it, but doctors can offer quite a few options to make their life better.

I then gave it some thought about why finding a ‘cure’ was so hard for most diseases, and came up with the below analogy of a river/sea, water dam, and a nicely functioning village/city (excuse my awful drawing!).

The first figure below sets the scene: there’s a water dam that’s keeping the river from flooding and damaging the nice village/city next to it. Now please read the caption of the below figure to make sense of how they’re related to a disease.

Prevention

The river/sea is the combination of your genetic risk (e.g. you could have inherited genetic variants from your parents that increased your chances of type-2 diabetes) and environmental exposures (e.g. for type-2 diabetes, that would be being obese, eating high sugar content diet, smoking). The water dam is your immune system and/or mechanisms in your body which tame the sea of risk factors to ensure that everything in your body work fine (e.g. pancreatic islet cells have beta cells which produce insulin to lower your glucose levels back to normal levels – which would be damaging to the body’s organs if it stayed high).

So to ‘prevent’ a disease (well, flooding in this case), we could (i) make the water dam taller, (ii) make the dam stronger, and (iii) do regular checks to patch any damage done to the dam. To provide an example, for type-2 diabetes, point (i) could correspond to being ‘fit’ (or playing with your genes, which currently isn’t possible), point (ii) could correspond to staying ‘fit’, and point (iii) could correspond to having regular check-ups to see whether any preventive measures are necessary. Hope that made sense. If not, please stop reading immediately and look for other blog posts on the subject matter 🙂

Using the figure below, I wanted to then move to ‘therapy’. So as you can see, the river has flooded i.e. this individual has the disease (e.g. type-2 diabetes as above). The water dam is now not doing a good job of stopping the river and the city is in danger of being destroyed. But we have treatments: (i) The (badly drawn) water pumping trucks suck up excess water, and (ii) we have now built a second (smaller) dam to protect the houses and/or slow the flow of the water. Again, to provide an example using type-2 diabetes, water pumping trucks could be analogous to insulin or metformin injections, and the smaller dams could be changing current diet to a ‘low sugar’ version. This way we can alleviate the effects of the current and future ‘floods’.

Therapy

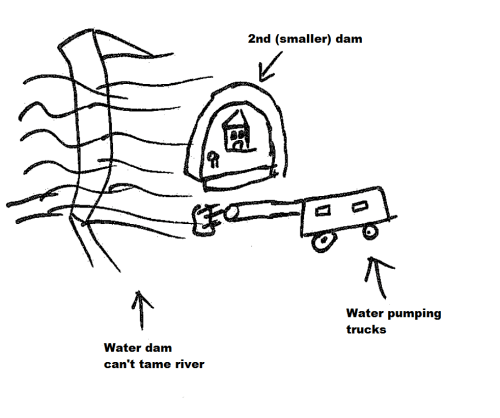
Analogy for therapy/treatment – after being diagnosed with the disease

Finally, we move on to our main question: ‘the cure’. Using the same analogy as above, as the water dam is now dysfunctional, the only way to stop future ‘floods’ would be to design a sewage system that can mop up all water that could come towards the city. Of course the water dam and ‘old city’ was destroyed/damaged due to past floods, so we’d need to build a new functioning city to take over the job of the old one. A related real example (off the top of my head) could be to remove the damaged tissues and replace them with new ones. Genetic engineering (using CRISPR/Cas9) and/or stem cell techniques are likely to offer useful options in the future.

Cure

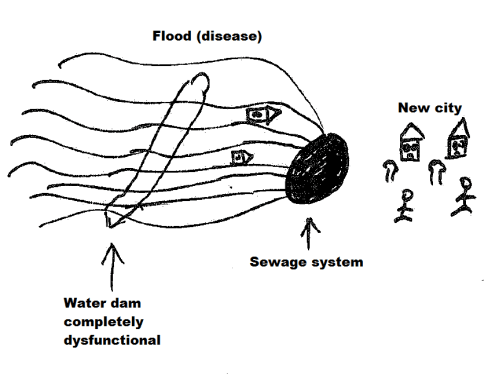
Analogy for cure – after being diagnosed with the disease

Hopefully it is now clear that the measures taken to prevent or treat the disease, cannot be used to cure the disease. E.g. you can build another dam in place of the old one, but the city is already destroyed so that’s not going to be of any use in curing the disease.

So to sum up, diseases like obesity, cancer, COPD are very complex diseases – in fact they’re called ‘complex diseases’ in the literature – and understanding their underlying biology is very hard (e.g. hundreds of genes and environmental exposures could combine to cause them). We’re currently identifying many causal variants but turning these findings into ‘cures’ is a challenge that we have not been able to crack yet. However, it is clear that the methods that we currently use to identify preventive measures and therapies cannot be used to identify cures.

I hope that was helpful. I’d be very happy to read your comments/suggestions and share credit with contributing scientists. Thanks for reading!

Read Full Post »

BBC_news_sperm_count

BBC news article published on the 18th March 2018. According to the article, men with low sperm counts are at a higher risk of disease/health problems. However, this is unlikely to be a causal relationship and more likely to be a spurious correlation. May even turn out to be the other way round due to “reverse causality”, a bias we encounter a lot in epidemiological studies. The following sounds more plausible (to me at least!): “Men with disease/health problems are likely to have low sperm counts” (likely cause: men with health problems tended to smoke more in general and this caused low sperm counts in those individuals).

As an enthusiastic genetic epidemiologist (keyword here: epidemiologist), I try to keep in touch with the latest developments in medicine and epidemiology. However, it is impossible to read all articles that come out as there is a lot of epidemiology and/or medicine papers published daily (in fact, too much!). For this reason, instead of reading the original academic papers (excluding papers in my specific field), I try to skim read from reputable news outlets such as the BBC, The Guardian and Medscape (mostly via Twitter). However, health news even in these respectable media outlets are full of wrong and/or oversensationalised titles: they either oversensationalise what the scientist has said or take the word of the scientist they contact – who are not infallible and can sometimes believe in their own hypotheses too much.

It wouldn’t harm us too much if the message of an astrophysics related publication is misinterpreted but we couldn’t say the same with health related news. Many people take these news articles as gospel truth and make lifestyle changes accordingly. Probably the best example for this is the Andrew Wakefield scandal in 1998 – where he claimed that the MMR vaccine caused autism and gastro-intestinal disease but later investigations showed that he had undeclared conflicts of interest and had faked most of the results (click here for a detailed article in the scandal). Many “anti-vaccination” (aka anti-vax) groups used his paper to strengthen their arguments and – although now retracted – the paper’s influence can still be felt today as many people, including my friends, do not allow their children to be vaccinated as they falsely think they might succumb to diseases like autism because of it.

The first thing we’re taught in our epidemiology course is “correlation does not mean causation.” However, a great deal of epidemiology papers published today report correlations (aka associations) without bringing in other lines of evidence to provide evidence for a causal relationship. Some of the “interesting ones” amongst these findings are then picked up by the media and we see a great deal of news articles with titles such as “coffee causes cancer” or “chocolate eaters are more successful in life”. There have been instances when I read the opposite in the same paper a couple of months later (example: wine drinking is protective/harmful for pregnant women). The problem isn’t caused only due to a lack of scientific method training on the media side, but also due to health scientists who are eager to make a name for themselves in the lay media without making sure that they have done everything they could to ensure that the message they’re giving is correct (e.g. triangulating using different methods). As a scientist who analyses a lot of genetic and phenotypic data, it is relatively easier for me to observe that the size of the data that we’re analysing has grown massively in the last 5-10 years. However, in general, we scientists haven’t been able to receive the computational and statistical training required to handle these ‘big data’. Today’s datasets are so massive that if we take the approach of “let’s analyse everything we got!”, we will find a tonne of correlations in our data whether they make sense or not.

To provide a simple example for illustrative purposes: let’s say that amongst the data we have in our hands, we also have each person’s coffee consumption and lung cancer diagnosis data. If we were to do a simple linear regression analysis between the two, we’d most probably find a positive correlation (i.e. increased coffee consumption means increased risk of lung cancer). 10 more scientists will identify the same correlation if they also get their hands on the same dataset; 3 of them will believe that the correlation is worthy of publication and submit a manuscript to a scientific journal; and one (other two are rejected) will make it past the “peer review” stage of the journal – and this will probably be picked up by a newspaper. Result: “coffee drinking causes lung cancer!”

However, there’s no causal relationship between coffee consumption and lung cancer (not that I know of anyway :D). The reason we find a positive correlation is because there is a third (confounding) factor that is associated with both of them: smoking. Since coffee drinkers smoke more in general and smoking causes lung cancer, if we do not control for smoking in our statistical model, we will find a correlation between coffee drinking and lung cancer. Unfortunately, it is not very easy to eliminate such spurious correlations, therefore health scientists must make sure they use several different methods to support their claims – and not try to publish everything they find (see “publish or perish” for an unfortunate pressure to publish more in scientific circles).

cikolata_ve_nobel_odulu

A figure showing the incredible correlation between countries’ annual per capita chocolate consumption and the number of Nobel laureates per 10 million population. Should we then give out chocolate in schools to ensure that the UK wins more Nobel prizes? However, this is likely not a causal relationship as it makes more sense that there is a (confounding) factor that is related to both of them: (most likely) GDP per capita at purchasing power parity. To view even quirkier correlations, I’d recommend this website (by Tyler Vigen). Image source: http://www.nejm.org/doi/full/10.1056/NEJMon1211064.

As a general rule, I keep repeating to friends: the more ‘interesting’ a ‘discovery’ sounds, the more likely it is to be false.

Hard to explain why I think like this but I’ll try: for a result to sound ‘interesting’ to me, it should be an unexpected finding as a result of a radical idea. There are just so many brilliant scientists today that finding unexpected things is becoming less and less likely – as almost every conceivable idea arises and is being tested in several groups around the world, especially in well researched areas such as cancer research. For this reason, the idea of a ‘discovery’ has changed from the days of Newtons and Einsteins. Today, ‘big discoveries’ (e.g. Mendel’s pea experimets, Einstein’s general relativity, Newton’s law of motion) have given way to incremental discoveries, which can be as valuable. So with each (well-designed) study, we’re getting closer and closer to cures/therapies or to a full understanding of underlying biology of diseases. There are still big discoveries made (e.g. CRISPR-Cas9 gene editing technique), but if they weren’t discovered by that respective group, they probably would have been discovered within a short space of time by another group as the discoverers built their research on a lot of other previously published papers. Before, elite scientists such as Newton and Einstein were generations ahead of their time and did most things on their own, but today, even the top scientists are probably not too ahead of a good postdoc as most science literature is out there for all to read in a timely manner (and more democratic compared to the not-so-distant past) and is advancing so fast that everyone is left behind – and we’re all dependent on each other to make discoveries. The days of lone wolves is virtually over as they will get left behind those who work in groups.

To conclude, without carefully reading the scientific paper that the newspaper article is referring to – hopefully they’ve included a link/citation at the bottom of the page! – or seeking what an impartial epidemiologist is saying about it, it’d be wise to take any health-related finding we read in newspapers with a pinch of salt as there are many things that can go wrong when looking for causal relationships – even scientists struggle to make the distinction between correlations and causal relationships.

power_posing

Amy Cuddy’s very famous ‘Power posing’ talk, which was the most watched video on the TED website for some time. In short, she states that if you give powerful/dominant looking poses, this will induce hormonal changes which will make you confident and relieve stress. However, subsequent studies showed that her ‘finding’ could not be replicated and she that did not analyse her data in the manner expected of a scientist. If a respectable scientist had found such a result, they would have tried to replicate their results; at least would have followed it up with studies which bring other lines of concrete evidence. What does she do? Write a book about it by bringing in anecdotal evidence at best and give a TED talk as if it’s all proven – as becoming famous (by any means necessary) is the ultimate aim for many people; and many academics are no different. Details can be found here. TED talk URL: https://www.ted.com/talks/amy_cuddy_your_body_language_shapes_who_you_are

PS: For readers interested in reading a bit more, I’d like to add a few more sentences. We should apply the below four criteria – as much as we can – to any health news that we read:

(i) Is it evidence based? (e.g. supported by a clinical trial, different experiments) – homeopathy is a bad example in this regard as they’re not supported by clinical trials, hence the name “alternative medicine” (not saying they’re all ineffective and further research is always required but most are very likely to be);

(ii) Does it make sense epidemiologically? (e.g. the example mentioned above i.e. the correlation observed between coffee consumption and lung cancer due to smoking);

(iii) Does it make sense biologically? (e.g. if gene “X” causes eye cancer but the gene is only expressed in the pancreatic cells, then we’ve most probably found the wrong gene)

(iv) Does it make sense statistically? (e.g. was the correct data quality control protocol and statistical method used? See figure below for a data quality problem and how it can cause a spurious correlation in a simple linear regression analysis)

graph-3

Wrong use of a statistical (linear regression) model. If we were to ignore the outlier data point at the top right of the plot, it becomes easy to see that there is no correlation between the two variables on the X and Y axes. However, since this outlier data point has been left in and a linear regression model has been used, the model identifies a positive correlation between the two variables – we would not have seen that this was a spurious correlation had we not visualised the data.

PPS: I’d recommend reading “Bad Science” by Ben Goldacre and/or “How to Read a Paper – The basics of evidence based medicine” by Trisha Greenhalgh – or if you’d like to read a much better article on this subject with a bit more technical jargon, have a look this highly influential paper by Prof. John Ioannidis: Why Most Published Research Findings Are False.

References:

Wakefield et al, 1998. Ileal-lymphoid-nodular hyperplasia, non-specific colitis, and pervasive developmental disorder in children. The Lancet. URL: http://www.thelancet.com/journals/lancet/article/PIIS0140-6736%2897%2911096-0/abstract

Editorial, 2011. Wakefield’s article linking MMR vaccine and autism was fraudulent. BMJ. URL: http://www.bmj.com/content/342/bmj.c7452

Read Full Post »

Autozplotter_mesut_erzurumluoglu

An example output from AutoZplotter using whole-exome sequencing data – used to identify the Primary ciliary dyskinesia causal gene, CCDC151, in Alsaadi and Erzurumluoglu et al, 2014 (read this paper’s story here). The green and red dots correspond to heterozygous and homozygous calls (for the alternative allele), respectively. The continuous blue lines correspond to the probability that the observed sequence of genotypes is not autozygous (e.g. close to zero means likely to be an autozygous region). LRoH: Long runs of homozygosity. NB: This image has been edited to ensure confidentiality/anonymity of the participant. Some LRoHs have been shortened or extended for this reason. If you’re thinking of using an AutoZplotter image in a paper, do not share genome-wide figures but maybe consider using chromosome-wide ones

When analysing whole-exome or whole-genome sequencing (or dense SNP chip) data obtained from consanguineous individuals with a rare Mendelian disease, the disease causal mutation usually lies within an autozygous region (characterised by long runs of homozygosity, LRoH, which are generally >5Mb). Thus checking whether any candidate genes overlap with an LRoH can substantially narrow region(s) of interest. There are several tools which can identify LRoHs such as Plink, AutoSNPa and AgilentVariantMapper. However, they all require their own formats and considerable computational knowledge; and also struggle to identify regions that are shorter than 5Mb. Thus, we wrote AutoZplotter, a user-friendly python script which plots the heterozygosity/homozygosity status of variants in a VCF file to allow for quick visualisation and manual identification of regions that have longer stretches of homozygosity than would be expected by chance.

VCF_format_v4

AutoZplotter accepts the VCF format – which is the standard format for storing genetic variation data from NGS platforms. Image Source URL: bioinf.comav.upv.es

The input format of AutoZplotter is VCF, thus it will be suitable for any type of genetic data (e.g. SNP array, WES, WGS) and from any species.

An older version of AutoZplotter was used in the analysis stage of Alsaadi et al (2012) and Alsaadi and Erzurumluoglu et al (2014).

To download latest version of AutoZplotter, click here (directs to ResearchGate). If you found AutoZplotter helpful in anyway, please cite Erzurumluoglu AM et al, 2015.


References:

Erzurumluoglu AM et al, 2015. Identifying Highly Penetrant Disease Causal Mutations Using Next Generation Sequencing: Guide to Whole Process. BioMed Research International. Volume 2015 (2015), Article ID 923491

Alsaadi MM and Erzurumluoglu AM et al, 2014. Nonsense Mutation in Coiled-Coil Domain Containing 151 Gene (CCDC151) Causes Primary Ciliary Dyskinesia. Human Mutation. Volume 35, Issue 12. Pages 1446–1448

Erzurumluoglu AM et al, 2016. Importance of Genetic Studies in Consanguineous Populations for the Characterization of Novel Human Gene Functions. Volume 80, Issue 3. Pages 187–196

Erzurumluoglu AM, 2015. Population and family based studies of Consanguinity: Genetic and Computational approaches. PhD Thesis. University of Bristol

Read Full Post »

This article was written for the lay audience in Hiyerarşi (Hierarchy) magazine in Turkey (July 2012).

Türkçesi: Yeni Teknolojik Gelişmelerin Işığında Akraba Evlilikleri (Hiyerarşi dergisi, Temmuz 2012)

Page 1

First page (page 25)

Page 2

2nd page (page 26)

Page 3

3rd page (page 27)

Page 4

Last page (page 28)

If you have any questions, please feel free to contact me…


Key references:

1- A. Mesut Erzurumluoglu, 2015. Population and family based studies of consanguinity: Genetic and Computational approaches. PhD thesis. University of Bristol.

2- Erzurumluoglu et al, 2016. Importance of Genetic Studies in Consanguineous Populations for the Characterization of Novel Human Gene Functions. Annals of Human Genetics.

Read Full Post »