Feeds:
Posts
Comments

Posts Tagged ‘usa’

evolution_of_intellectual_freedom_cham_phdcomics

Source URL: PhD Comics

Figuratively speaking, what is the ‘worth’ of a certain academic? Between two academics, which one has had more positive academic impact than the other? How do you rank academics? And award grants, promotion, tenure etc. to the best* ones?

I’m not going to answer these questions but would like to chip in with some food for thought and suggestions.

Well; one may say: “It’s easy! Just compare their h-index and total no of citations!

This may be an effective way to go about answering the question. Surely someone with an h-index of 30 has had more positive academic impact than someone with let’s say an h-index of 15 – and is the better candidate?

Maybe – that is if all things are equal regarding the way citations and the h-index works i.e. if both academics:

  • are in similar fields – as papers in certain fields receive more citations overall than papers in other fields,
  • are in similar stages in their careers – as comparing an early-career postdoc with an established “Prof.” wouldn’t be fair,
  • have similar numbers of first/equal-first or last author papers – as an academic with many middle-authorships can have excessively inflated h-indexes,
  • have similar number of co-authors – as it may be easier to be listed as a co-author in some fields than others and/or mean that more people will be presenting and citing the paper as their own, and
  • have a similar distribution of citations across the papers – as the h-index ignores highly influential papers and the total citations can be highly influenced by even just one of these (see figure below).

I may have missed other factors, but I think these are the main ones (please add a comment below).

mesut_erzurumluoglu_h-index_academic_2018

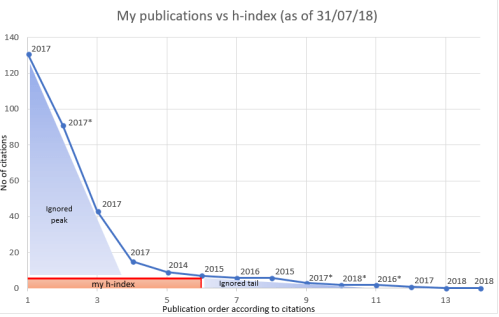
Calculating my h-index: Although problematic (discussed here), the h-index has become the standard metric when measuring the academic output of an academic. It is calculated by sorting the publications of an academic from most to least cited, then checking whether he/she has h papers with h citations e.g. if an academic has 10 papers with ≥10 citations but not 11 papers with ≥11 citations then their h-index will be 10. It was proposed as a way to summarise the number of publications that an academic has and their academic impact (via citations) with a single number. The above citation counts were obtained from my Google Scholar page

As of 31st July 2018, I have 14 published papers – including 5 as first/equal-first author – under my belt. I have a total citation count of 316 and an h-index of 6 (225 and 5 respectively, when excluding publications marked with an asterisk in the above figure). It is fair to say that these numbers are above average for a 29-year-old postdoc. But even I’m not content with my h-index – and many established academics are definitely right not to be. I’ll try and explain why: the figure above shows the citation distribution of my 14 publications sorted by the ‘number of times cited’ from the left (highest) to right (lowest). One can easily see that the h-index (red box) captures only a small portion of the general picture (effectively, 6 x 6 i.e. 36 citations) and ignores the peak (>6 on the y-axis) and tail (>6 on the x-axis) of the publication-citation distribution. I have also included the publication year of each paper and added an asterisk (*) against the publications where I haven’t provided much input e.g. I have done almost nothing for the Warren et al (2017) paper but it constitutes almost a third of my total citations (90/316)**. The ‘ignored peak’ contains three highly cited papers to which I have made significant contributions to and the ‘ignored tail’ contains research papers that (i) I am very proud of (e.g. Erzurumluoglu et al, 2015) or (ii) are just published – thus didn’t have the time to accumulate citations. What is entirely missing from this figure are my (i) non-peer-reviewed publications (e.g. reports, articles in general science magazines), (ii) correspondence/letters to editor (e.g. my reply to a Nature News article), (iii) blog posts where I review papers or explain concepts (e.g. journal clubs), (iv) shared code/analysis pipelines, (v) my PhD thesis with potentially important unpublished results, (vi) other things in my CV (e.g. peer-review reports, some blog posts) – which are all academia-related things I am very proud of. I have seen other people’s contributions in relation to these (e.g. Prof. Graham Coop’s blog) and thought that they were more useful than even some published papers in my field. These contributions should be incorporated into ‘academic output’ measures somehow.

It is also clear that “just compare their h-index and total no of citations!” isn’t going to be fair on academics that (i) do a lot of high-quality supervision at different levels (PhD, postdoc, masters, undergrad project – which all require different skill sets and arrangements), (ii) spend extra time to make their lectures inspiring and as educative as possible to undergrad and Masters students, (iii) present at a lot of conferences, (iv) do ‘admin work’ which benefits early-career researchers (e.g. workshops, discussion sessions), (v) do a lot of blogging to explain concepts, review papers, and offer personal views on field generally, (vi) have a lot of social media presence (e.g. to give examples from my field i.e. Genetic Epidemiology, academics such as Eric Topol, Daniel MacArthur, Sek Kathiresan take time out from their busy schedules to discuss, present and debate latest papers in their fields – which I find intellectually stimulating), (vii) give a lot of interviews (TV, online media, print media) to correct misconceptions, (viii) take part in public engagement events (incl. public talks), (ix) organise (inter-disciplinary) workshops, (x) inspire youngsters to become academics working for the benefit of humankind, (xi) publish reliable reports for the public and/or corporations to use, (x) provide pro bono consultation, (xi) take part in expert panels and try very hard to make the right decisions, (xii) engage in pro bono work, (xiii) do their best to change bad habits in the academic circles (e.g. by sharing code, advocating open access publications, standing up to unfair/bad decisions whether it affects them or not), (xiv) extensively peer-review papers, (xv) help everyone who asks for help and/or reply to emails… The list could go on but I think I’ll stop there…

I acknowledge that some of the above may indirectly help increase the h-index and total citations of an individual but I don’t think any of the above are valued as much as they should be per se by universities – and something needs to change. Academics should not be treated like ‘paper machines’ until the REF*** submission period, and then ‘cash cows’ that continually bring grant money until the next REF submission cycle starts. As a result, many academics have made ‘getting their names into as many papers as possible’ their main aim – it is especially easier for senior academics, many with a tonne of middle-authorships for which they have done virtually nothing****. This is not how science and scientists should work and universities are ultimately disrespecting the tax payers’ and donors’ money. Some of the above-mentioned factors are easier to quantify than others but thought should go into acknowledging work other than (i) published papers, (ii) grant money brought in, and maybe (iii) appearing on national TV channels.

Unless an academic publishes a ‘hot paper’ as first or corresponding author – which very few have the chance and/or luck to do – and he/she becomes very famous in their field, their rank is usually dictated by the h-index and/or total citations. In fact, many scientists who have very high h-indexes (e.g. because of many middle-author papers) put this figure at the top of their publication list to prove that they’re top scientists – and unfortunately, they contribute to the problem.

People have proposed that contributions of each author are explicitly stated on each paper but this is going to present a lot of work when analysing the academic output of tens of applicants – especially when the number of publications an individual has increases. Additionally, in papers with tens or even hundreds of authors, general statements such as “this author contributed to data analysis” are going to be assigned to many authors without explicitly stating what they did to be included as a co-author – thus the utility of this proposition could also be less than expected in reality.

It’s not going to solve all the problems, but I humbly propose that a figure such as the one above be provided by Google Scholar and/or similar bibliometric databases (e.g. SCOPUS, CrossRef, Microsoft Academic, Loop) for all academics, where the papers for which the respective academic is not the first author are marked with an asterisk. The asterisks could then be manually removed by the respective academic on publications where he/she has made significant contributions (i.e. equal-first, corresponding author, equal-last author or other prominent role) but wasn’t the first author. Metrics such as the h-index and total citations could then become better measures by giving funders/decision makers the chance to filter accordingly.

Thanks for reading. Please leave your comments below if you do not agree with anything or would like to make a suggestion.

academic_worth_researcher_university_mesut_erzurumluoglu

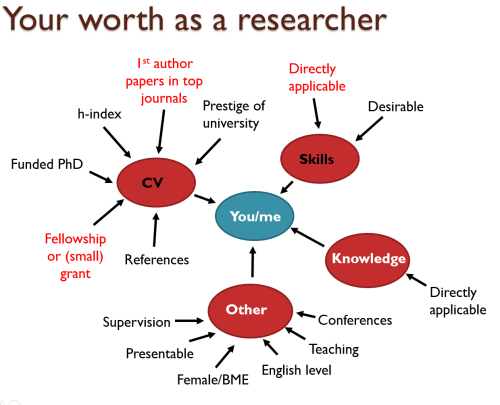
The heuristic that I think people use when calculating the worth of an early career researcher (but generally applies to all levels): ‘CV’ and ‘Skills’ are the two main contributors, with the factors highlighted in red carrying enormous weight in determining whether someone should get the job/fellowship or not. Virtually no one cares about anything that is outside what is written here – as mentioned in the post. Directly applicable: Some technical skill that the funder/Professor thinks is essential for the job; Prestige of university: where you did your PhD and/or undergrad; Funded PhD: whether your PhD was fully funded or not; Female/BME: being female and/or of BME background – this can be an advantage or a disadvantage depending on the regulations/characteristics of the university/panel, as underrepresented groups can be subjected to both positive and negative discrimination. NB: this is a simplified version and there are many factors that affect outcomes such as “who you know” and “being at the right place at the right time“.


Added on 30/10/18: I just came across ‘No, it’s not The Incentives—it’s you‘ by Tal Yarkoni about the common malpractices in academic circles, and I think it’s well worth a read.


*Making sure there’s a gender balance and that academics from BME backgrounds are not excluded from the process – as they’ve usually had to overcome more obstacles to reach the same heights.

**I have been honest about this in my applications and put this publication under “Other Publications” in my CV.

***REF stands for the ‘Research Excellence Framework’, and is the UK’s system for assessing the quality of research in higher education institutions. The last REF cycle finished in 2014 and the next one will finish in 2021 (every 7 years). Universities start planning for this 3-4 years before the submission dates and the ones ranked high in the list will receive tens of millions of pounds from the government. For example, University of Oxford (1st) received ~£150m and University of Bristol (8th) received ~£80m.

****Sometimes it’s not their fault; people add senior authors on their papers to increase their chances of getting them accepted. It’s then human nature that they’re not going to decline authorship. It sounds nice when one’s introduced in a conference etc. as having “published >100 papers with >10,000 citations” – when in reality they’ve not made significant (if any!) contributions to most of them.


PS: I also propose that acknowledgements at the bottom of papers and PhD theses be screened in some way. I’ve had colleagues who’ve helped me out a lot when learning some concepts who then moved on and did not have the chance to be a co-author on my papers. I have acknowledged them in my PhD thesis and would love to see my comments be helpful to these colleagues in some way when they apply for postdoc jobs or fellowships. Some of them did not publish many papers and acknowledgements like these could show that they not only have the ability to be of help (e.g. statistical, computational expertise), but are also easy to work with and want to help their peers.

Read Full Post »

Difference between the lung of a COPD patient and an unaffected one. Image taken from NHLBI website (click on image to access the source)

Difference between the lung of a COPD patient and an unaffected one. Image taken from the NHLBI website (one of the leading institutes in providing information on various diseases; click on image to access the source)

Many of us will either suffer or have a relative/friend who suffers from a disease called Chronic Obstructive Pulmonary Disease (COPD, click on link for details) which is a progressive respiratory disease characterised by decreasing lung function (struggling to inhale/exhale air, irreversible airflow obstruction), very likely accompanied by chronic infections. COPD has a prevalence of over 2% in the UK population (corresponding to approx. 1 million in the UK, probably a lower bound estimate due to many undiagnosed cases; this figure is approx. 16 million in the USA) and is currently the third biggest killer in the world (only behind cancers and heart-related diseases) – costing the lives of millions (in the USA alone, number of deaths attributed to COPD is over 100 thousand); and the health services, billions of pounds.

Contrary to the well-known genetic disorders such as Cystic Fibrosis and Huntington’s disease, which are diseases caused entirely by a person’s genetic makeup and caused by mutations in a single gene, COPD is a (very!) complex disease with many genes and environmental factors (e.g. smoking, pollutants) contributing to the development/progression of the disease. This complexity makes it much harder to dissect the causes and find potential (genetic) targets for cures or therapies. However, we do know that smoking is by far the biggest risk factor with up to 90% of those who go on to develop clinically significant COPD being smokers. But only a minority (<25%) of all smokers develop COPD, indicating the strong role genetics can play in the progression of this disorder. Also not all COPD patients are smokers (up to 25% in some populations), indicating that – at least in some patients – genetics can play a rather determining role. I must stress that all the statistics I provide here can vary considerably from population to population due to different lifestyles and genetic backgrounds.

Genetic_epidemiology_genetics_mesut_erzurumluoglu

I – together with a large group of collaborators – search for genetic predictors of lung function, which helps us to identify which individuals are more likely to develop the disease and potentially understand the underlying biology/pathology of respiratory diseases such as COPD and asthma, and related traits such as smoking behaviour. To do this, we carry out what is called a genome-wide association study (GWAS, click on link for details), where we obtain the genetic data (millions of data points) from tens of thousands of COPD (or asthma) patients and ‘controls’ (people with normal lung function). To ensure that our results are not biased by different ethnicities, life styles and related individuals, we collect all the relevant information about the participants and make sure that we control for them in the statistical models that we use. GWASs have been extremely successful in the identification of successful targets for other diseases and have led to the field of Genetic Epidemiology (GE, click on link for details) to come to the fore of population-based medicine. GE requires extensive understanding of Statistics (needed to make sense of the very large datasets), Bioinformatics (application of computer software to the management of large biological data), Programming (needed to change data formats, manage very large data), Genetics (needed for interpretation of results) and Epidemiology (branch of medicine which deals with how often diseases occur in different groups of people, and why); thus requires inter-disciplinary collaborations.

GWAS results are traditionally presented with a Manhattan plot (due to its resemblance of the city's skyline) where the genetic variants corresponding to the dots above the top grey line (representing P values less than 5e-7 i.e. 0.0000005) are usually followed up with additional studies to validate their plausibility. Image taken from Wikipedia (click on image to access source)

GWAS results are traditionally presented with a Manhattan plot (due to its resemblance of the city’s skyline) where the genetic variants corresponding to the dots above the top grey line (representing P-values less than 5e-8 i.e. 0.00000005) are usually followed up with additional studies to validate their plausibility. Image taken from Wikipedia (click on image to access source)

The inferences we make from these studies can shed light in to which genes and biological pathways play key roles in causing COPD. We then follow up these newly identified genes and pathways to analyse whether there are molecules which could be used to target these and be potential drugs for treating COPD patients. Our results can be of immense help to Pharmaceutical companies (and ultimately to patients), as many clinical trials initiated without genetic line of evidence have failed, costing the public and these companies billions of pounds.

As smoking is the biggest risk factor for respiratory diseases like COPD, I am – also with the contribution of many collaborators – in the process of analysing whether some people are more likely to start smoking, stop after starting, and smoke more than usual when they start smoking. The results can have huge implications as many people struggle to stop smoking, and when they do, research suggests that up to 90% (figure differs between populations) of them start to smoke again within the first year after quitting. Smoking is not only a huge contributor to the risk of developing COPD, but also to lung (biggest killer amongst all cancers), mouth, throat, kidney, liver, pancreas, stomach and colon cancer (not an exhaustive list). In the UK alone, these cancers cause the slow and painful death of tens of thousands, alongside a huge psychological and financial burden on the families and public resources.

The “lung” and the short of it (stealing a phrase thought up by my colleagues at the University of Leicester, click on link to see who they are) is that COPD is a disease that is going to affect many of us, and any useful finding which leads to cures and/or therapies could increase the life years of COPD patients and affect the lives of thousands of people directly, and millions indirectly (e.g. families of COPD sufferers, cost to the NHS). Finding targets to help people stop smoking can potentially have even bigger implications as many continue to smoke, despite huge efforts and funding allocated to smoking prevention and cessation.

A nice TED talk about the world of Data science and Genetic Epidemiology

Addition to post (09/02/17): A Circos plot presenting results from our latest lung function GWAS (Wain et al, 2017; Nature Genetics) was shortlisted (title: Breathtaking genes) and displayed in the Images of Research exhibition (9th Feb 2017) organised by the University of Leicester

Read Full Post »

Laws regarding first-cousin marriage around the world. Navy blue: First-cousin marriage legal. Light Blue: Allowed with restrictions or exceptions. Yellow: Legality dependent on religion or culture. Red: Statute bans first-cousin marriage. Pink: Banned with exceptions. Dark Red: Criminal offense. Grey: No available data. The image has been released into the public domain by the author (URL: http://en.wikipedia.org/wiki/Cousin_marriage).

Laws regarding first-cousin marriage around the world. Navy blue: First-cousin marriage legal. Light Blue: Allowed with restrictions or exceptions. Yellow: Legality dependent on religion or culture. Red: Statute bans first-cousin marriage. Pink: Banned with exceptions. Dark Red: Criminal offense. Grey: No available data. The image has been released into the public domain by the author (URL: http://en.wikipedia.org/wiki/Cousin_marriage).

The answer is (studying) consanguinity (i.e. unions between relatives such as first-cousin marriages); and one cannot understand the complexity of the issue (and make ‘informed’ decisions) without reading the literature of these five apparently unconnected fields. It is fair to say that there is a degree of hostility towards consanguineous marriages in Western societies. However this perception is usually attained without in-depth knowledge on the genetic effects of consanguinity. In short, consanguinity per se (i.e. on its own) does not cause a disorder, but rather it increases the probability of an autosomal recessive disorder (which require two copies of the same) causal mutation to be in a homozygous state (i.e. possess two copies of the same mutation). When this happens both copies of the genes we inherited from our parents do not function properly.

Unions between individuals who are second-cousins or closer are considered ‘consanguineous’ in clinical genetics. Consanguineous families with diseases have been studied thoroughly by clinical geneticists for the last two-three decades – and this has allowed for identification of many disease causal genes. However, studying consanguineous populations as a whole rather than ‘cherry picking’ families with disease can offer much more for better understanding our genome and therefore finding new targets for preventive and curative medicine. Many genes in our genome still have unknown functions and we have merely scratched the surface in terms of their interactions. I hypothesise that assigning a function to the thousands of remaining genes will only be feasible if consanguineous populations are studied as a whole (i.e. also including families without disease to the studies) and I therefore carry out theoretical studies to estimate the sample size needed and how many genes will be completely ‘knocked-out’ if these studies were to be carried out. This approach proposes a ‘paradigm shift’ in clinical genetics.

Global prevalence of consanguineous unions. Consanguinity has deep roots in many cultures and it is impossible to interfere/intervene from the outside without first understanding why people engage in cousin marriages. Image source URL: www.consang.net/

Global prevalence of consanguineous unions. Consanguinity has deep roots in many cultures and it is impossible to interfere/intervene from the outside without first understanding why people engage in cousin marriages. Image source URL: http://www.consang.net/

Consanguineous unions occur very rarely in Western countries for a variety of sociological (e.g. cultural, negative media coverage) and statistical reasons (e.g. smaller families means fewer cousins at similar age), but the complete opposite is true in certain regions of the world where union of kin is seen as the default choice. Conservative estimates predict that approximately one-sixth of the world’s population (a figure of 1.1 billion is proposed by the Geneva International Consanguinity Workshop Report) live in highly consanguineous regions; and also another one-sixth falls into the ‘unknown’ category – reflecting the need for further research. Historically, consanguineous unions were also common amongst the elite in the UK (up to mid-19th century, including Charles Darwin), the Pharaohs and the Royal families of Europe (e.g. Habsburgs).

Views of main religions towards consanguineous marriages. NB: Where first-cousin marriages are allowed, lower levels of consanguinity are also allowed. Image Source: Copy-pasted from my own PhD thesis

The increase in the probability of a mutation being homozygous will depend on the level of relatedness between the parents. For example, approximately 6.25% of mutations are expected to be homozygous in the offspring of first cousins. This figure would be (near) 0% in the offspring of outbred individuals. Genetically, this is the main difference between union of kin and union of unrelated individuals. We all have many disease-causal mutations in our genomes (but in heterozygous state, i.e. one normal copy and one mutated copy) and different kinds of mutations are out there in all populations. However because these mutations will be very rare or are unique to you or your family, they do not get to meet their counterpart when you have offspring with an unrelated individual. Therefore the mutation’s homozygous effects are never observed. This is why rare autosomal recessive disorders are almost always seen in consanguineous offspring.

This difference in homozygosity levels is also one of the main reasons behind the necessity of studying consanguineous individuals and populations. These studies can turn unfortunate events (e.g. disorder in families) to a great use for medical sciences. Not only will identifying a disease-causal mutation help with diagnostics, they can enable scientists to understand what certain genes do and help us understand why the gene causes that disease. Rare instances can be highly informative about preventable outcomes relevant to the whole population. For example, had more notice been taken in the 1980s of the proof which familial hypercholesterolemia provided for the causal role of cholesterol in coronary heart disease (CHD), high cholesterol intake would have been better addressed for the nation a decade sooner. To provide numbers, CHD is still the UK’s biggest killer causing over 80 thousand deaths a year, thus paying more attention to information that was coming from studies of consanguineous unions could have saved thousands of lives just in this single case.

Given the advancements in genetic diagnostics (e.g. huge decreases in costs of DNA sequencing), screening for all known mutations will become feasible in the near future for everybody – and identifying disease-causal mutations will become even more useful for all of us. Our genomes are constantly being mutated and my approach will enable a much broader understanding of our genome by observing these mutations’ homozygous effects. Finally, rather than discourage (See link for an example) consanguineous marriages totally (not feasible in the foreseeable future due to many socio-economic and cultural reasons), for those willing to marry a cousin, screening for previously identified mutations will help these couples take more informed decisions.

consanguinity factors culture socio-economic

Factors influenced by consanguinity and culture. Image Source: Copy-pasted from my own PhD thesis (hence the Figure 1.10)

Key reference:

A. Mesut Erzurumluoglu, 2016. Population and family based studies of consanguinity: Genetic and Computational approaches. PhD thesis. University of Bristol.

Erzurumluoglu AM et al, 2016. Importance of Genetic Studies in Consanguineous Populations for the Characterization of Novel Human Gene Functions. Annals of Human Genetics, 80: 187–196.


PS: Whilst the media is mostly responsible for portraying consanguinity the way they understand (and with more contrast added on of course), they could be forgiven as the genetic effects of consanguinity is not fully understood amongst geneticists either, especially in the field of complex trait genetics – thus the extra incentive for studying them.

Read Full Post »

Obesity is a big problem World-wide

Obesity is a ‘big fat’ problem World-wide (Image from Wikipedia)

Obesity increases the risk of a variety of disorders such as coronary heart disease (UK’s biggest killer!) and cancer (e.g. colon, breast) and influences other health related traits such as increasing blood pressure and blood fats. Therefore it is always important to know what your normal range for body mass index (BMI) is. Keeping within this range is bound to decrease your risk for obesity related disorders – although should not be solely relied on. Intake of right amount of minerals and vitamins is also crucial.

The NHS have created an online BMI calculator which I found very useful:

BMI healthy weight calculator


PS: Please also check the BMI of your loved ones (especially elder members) as most people usually ignore the early signs and become obese… Warn them if they’re overweight so that it is easier to lose weight compared to when they’re already obese!

PPS: There is also some useful and succinct info on this website

content provided by NHS Choices

Read Full Post »

Peace is the only way forward! (Image from www.israellycool.com)

Peace is the only way forward – for both sides! (source URL: www.israellycool.com)

A few hate-driven Palestinians (or whoever they are) fire rockets to Israel aiming to kill their citizens. Israel has the right to find and punish them (and only them!). However, what Israel does is go out and kill civilians (including many children and women) in return by using weapons of mass destruction. Now tell me what the difference is between Israel (a state) and those few brainless radicals. I really can’t see the difference in the way they act. Surely a state has to act differently than a bunch of terrorists! We must be against anyone, any group and any state who kills civilians! It doesn’t matter who they are or what they claim to represent! Terrorism (and killing civilians) has no religion or ideology!

Graffiti in Bristol, UK - Palestinian people deserve freedom and independence just like Israel does

Graffiti in Bristol, UK – Palestinian people deserve freedom, peace and independence just like Israel

Belfast International Peace Murals

Belfast International Peace Murals

Both sides must take a long hard look at themselves. As long as these atrocities carry on (on both sides) and we keep turning a blind eye, there’ll never be peace in the Middle East; and therefore the World. For peace to ever become sustainable, inter-faith and inter-cultural dialogue is a must! People must learn and agree to disagree! I do not want to see one more life ending prematurely due to terrorism (by radical groups or by states) – on both the Palestinian and the Israeli side; or any other side! One life is one too many!

The greatest way to avenge your enemy is by learning to forgive” – Quote from the documentary

Read Full Post »

Temel and Dursun are (semi!) fictional characters, originated in the Black sea region of Turkey known for their humour, wit and craziness (this last attribute is sometimes replaced by naivity) all at the same time; therefore many jokes have been told about them which fit their characteristics. For more info on Turkish sense of humour, click here.

Temel

How Temel is usually depicted in cartoons – especially with a big and long nose, a well-known characteristic of the ‘Laz’ people living in the Black sea region of Turkey


Here’s just a few of them; they’re much better in Turkish as there is a lot in these jokes which is lost in translation. Hope you enjoy them anyway!

Joke 1:

Dursun has made a lot of money in the USA and tells his beloved friend Temel to join him in LA. He tells him there are so many opportunities for him to earn his living here, going even further to say he’d be rich even if he picks up the money people throw/drop on the streets. So Temel jumps on the first plane and travels to the US; and with his first step he sees a $10 note on the floor. But he decides not to take it, saying: “I’m not going to start working on the first day!“.

Joke 2:

Temel owes a lot of money to the local shops. One day he wins the lottery and the locals wait for him to pay back what he owes – and maybe more. However three months down the line, Temel still hasn’t paid anything so the shopkeepers come down to ask why that is the case. Temel tells them: “I didn’t want you guys to think money’s changed me!

Joke 3:

Temel asks a cafe owner: “Do you have cold tea?” and he gets the reply “No“, so he leaves. He keeps asking the same question for the next three days so the cafe owner thinks I’ll make him cold tea the next day. Temel comes in and asks the same question, but this time the cafe owner says “yes”. Then Temel says: “well that’s great, heat it up and bring me some tea. I’ve missed drinking tea a lot!

Joke 4:

Temel enters a multi-choice matriculation exam. He flips a coin for each question and picks the choices accordingly. An hour into the exam – when all the students have given in their papers and he’s the only one left in the room, the invigilator sees that he’s still flipping coins; and tells him there isn’t much time left and asks him whether he is about to finish. Temel answers: “I’ve finished half an hour ago, just going through my answers!”

Joke 5:

Temel and Dursun love playing football. One day when they were contemplating about the afterlife, Temel asks Dursun: “Do you think there is football in Heaven?” and Dursun answers “I don’t know but whoever goes there first, will let the other know OK?“. So they agree and a few years down the line Dursun dies and appears in Temel’s dream: “Temel, I’ve got one good and one bad news for you“. Temel asks for the good one first and Dursun answers: “There is football in Heaven!

What about the bad one?

Your name is on the team sheet this week!

Joke 6:

When they’re young, Temel and Dursun try stealing a few apples from a tree in a garden nearby. While they’re at it, the owner sees them and they start to run. The owner shouts “stop you BASTARD!”; and Dursun stops and tells Temel “he recognised me, you keep running brother!”

Joke 7:

Temel and Dursun are stopped by a tourist in Istanbul. He asks: “Hi, do you speak English?“. Temel and Dursun look at each other, not understanding what he meant. The tourist also asks: “Parlez vous Francais?” and said the same thing in many other languages. The tourist then leaves not getting an answer.

Dursun turns to Temel and says: “I think it is time we learn a foreign language“.

Temel: “What’s the point? Look he knew 5 languages but still couldn’t explain what he wanted“.

Joke 8:

Temel appears in court as he has just killed a dozen or so people at a marketplace due to his truck’s brakes failing. The judge asks: “Explain why you did this?“.

Temel: “I am very sorry; it was not intentional. My brakes failed and I had no other choice but to hit somewhere to stop my truck. I noticed that if I swerved to the right I would kill a child. If I swerved to the left, I would enter the marketplace and potentially kill dozens. So I decided to kill the child.”

Judge: “How did you then kill all these people?!

Temel: “Unfortunately the kid ran towards the marketplace

Joke 9:

Temel and Dursun go to watch a movie, which has a horse racing scene. Just as the race is about to start, Temel bets Dursun that the white horse will win – and Dursun agrees to bet on the black horse. The white horse won, so Temel also won the bet. However, after the movie Temel feels uneasy and confesses:

I watched this movie before and knew which horse was going to win.

Dursun replies: I watched the movie too.

But I wanted to bet on the underdog this time!

Joke 10:

Temel is on Who Wants to be a Millionaire. He passes the first set of ‘easy’ questions…

£4000 question: How long did the ‘Hundred Years’ War’ last?

a) 99 years b) 116 years c) 150 years d) 100 years

He asks the audience and passes on to the next question

£8000 question: Where did the ‘Panama hat’ originate?

a) Panama b) Brazil c) Chile d) Ecuador

He phones a friend and passes on to the next question

£16000 question: When do the Russians celebrate the ‘October Revolution’?

a) October b) September c) November d) January

He uses the ‘fifty-fifty option’ and passes on to the next question

£32000 question: What animal were the ‘Canary Islands’ named after?

a) Canaries b) Seals c) Cats d) Kangaroos

Temel decides to take the money…

[Scroll down]

Funny eh? Thought you were more clever than Temel? Think again!

Answers: 1) 116 years, 2) Ecuador, 3) November, 4) Seals

Read Full Post »