by Dr A. Mesut Erzurumluoğlu | Principal Bioinformatician at Bicycle Therapeutics (formerly at Boehringer Ingelheim, and Univs. of Cambridge, Leicester & Bristol) – blogging since 2006. All views mine unless stated otherwise
Note to non-Turkish speakers: This is a (2-hour) ‘Introduction to Genetic Epidemiology’ course in Turkish (Türkçe) by Mine Köprülü (PhD student in Genetic Epidemiology at the University of Cambridge) and myself (Dr Mesut Erzurumluoğlu – Genetic Epidemiologist at the University of Cambridge). Feel free to send the YouTube link to Turkish-speaking youngsters who may be interested in a career in genetics, epidemiology or related fields.
Türkiye Biyolojik Bilimler Ağı Sunumu (08/03/2021)
Cambridge Üniversitesi’nde (MRC Epidemiology Unit) doktora öğrencisi olan Mine Köprülü’yle beraber ‘Genetik Epidemiyoloji Nedir? Terminolojisi ve Epidemiyolojik Analizler‘ konulu (iki saatlik) sunumumuza Türkiye Biyolojik Bilimler Ağı‘nın YouTube kanalından ulaşabilirsiniz.
Umarız faydalı olmuştur. Spesifik sorularınız olursa bize Twitter ya da email yoluyla ulaşabilirsiniz.
Türkiye'de daha tam oturmamış bir alanı Türkçe sunmak kendi adıma kolay olmadı ama katılımcılar bayağı ilgiliydi. Sonlara doğru yorulduk hepimiz ama yine de faydalı olmuşa benziyor. Organizasyonda emeği geçen herkese teşekkur ederim @TBBA2020@KopruluMinepic.twitter.com/60OIuk4oq8
— A. Mesut Erzurumluoğlu (@mesuturkiye) March 8, 2021
It is not the strongest of the species that survives, nor the most intelligent that survives. It is the one that is most adaptable to change – attributed to Charles Darwin
“How did you get accepted to Cambridge?”
I saw a tweet a while ago which said something along the lines of: “If you’ve been asked the same question three times, you need to write a blog post about it”. I get asked about how I got my current postdoc job at the University of Cambridge all the time. Therefore, I decided to write this document to provide a bit of a backstory as I did many things over the years which – with a bit of luck – contributed to this ‘achievement’.
It is a long document but hopefully it will be worth reading in full for all foreign PhD students, newPostdocs and undergraduates who want an introduction to the world of academia in the UK. I wish I could write it in other languages (for a Turkish version click here) to make it as easy as I can for you, but I strived to use as less jargon as possible. Although there is some UK-specific information in there, the document is mostly filled with general guidance that will be applicable to not just foreign students or those who want to study in the UK, but all PhD students and new Postdocs.
I can only hope that there are no errors and every section is complete and fully understandable but please do contact me for clarifications, suggestions and/or criticism. I thank you in advance!
To make a connection between academia in the UK and the quote attributed to Darwin above, I would say being very clever/intelligent is definitely an advantage in academia but it is not the be-all and end-all. Learning to adapt with the changing landscape (e.g. sought-after skills, priorities of funders and PIs), keeping a good relationship with your colleagues and supervisors, and being able to sell yourself is as, if not more important. Those who pay attention to this side of academia usually make things easier for themselves.
I hope the below document helps you reach the places you want to reach:
A really useful document for UK PhD students – particularly those from abroad. It's Mesut's personal take, focused on genepi, but there is some really useful stuff here. https://t.co/V4sEy5vXMQ
After performing a genome-wide association study (GWAS), we’d then ideally want to link the identified associations/SNPs to (druggable) genes and biological pathways. Unearthing novel biology can inform drug target (in)validation but also lead to higher-impact publications (see ‘selected publications’ below). The latter point is especially important for early-career researchers who will be applying for fellowships and/or lectureships soon 🙂
Happy to help out with any of the below.
A slide from my Journal club on the October 2017 GTEx paper: Identifying the causal variants and genes, and the relevant tissues and pathways is the ultimate aim of GWASs. If the causal gene(s) turns out to be ‘druggable’, it can lead to pharmaceutical companies to develop treatments for the disease of interest. See My Research page to download the full slides.
Methods and Software
The below are some of the Post-GWAS ‘SNP follow-up’ steps/software that I have been taking/using for the last 2-3 years:
1- Finemapping the identified signals:
This step refines each signal to a set of variants that are 99% likely to contain the underlying causal variant – assuming the causal variant has been analysed
• Wakefield method [1] – Output: 99% credible set (Tutorial and R code available here: Wakefield_method_finemapping)
2- Query eQTL databases:
Rather than just assume that the gene nearest to the sentinel SNP is the causal gene, we can bring in other lines of evidence such as eQTL and pQTL analyses to check whether the SNP(s) is associated with the expression of a gene.
• GTEx v7 dataset (n up to 492; RNASeq) [2] – publicly available at [3] (see My Research page to download my Journal club slides on GTEx v6 paper)
• NESDA-NTR Blood eQTL dataset (n=4,896; microarray) [4] – publicly available at [5]
• Lung eQTL dataset (n=1,111; microarray) [6] – need to request lookups from Dr. Ma’en Obeidat
• BIOS (Biobank-Based Integrative Omics Study) Blood eQTL dataset (n=2,116; RNAseq) [7] – publicly available at [8]
• Westra et al Blood eQTL dataset (n=5,311 with replication in 2,775; microarray) [9] – publicly available at [10]
• There are other tissue/organ specific databases such as BRAINEAC (n=134) and Brain xQTL (n=up to 494)
• It also helps to plot the Z-scores of the eQTL (separate plots for each gene near the signal) and GWAS SNPs on the same plot – maybe with the SNPs in the 99% credible set mark differently to other SNPs near the sentinel SNP. Of course, choosing the relevant tissue(s) is crucial!
4- Query pQTL databases:
• Sun et al, 2018 dataset [13] – need to request lookups from the authors (maybe Dr. Adam Butterworth)
5- Variant effect prediction:
Checking whether our sentinel SNP is in LD with a coding variant that is predicted to be functional provides another line of evidence for a putatively causal gene.
• DeepSEA – for noncoding SNPs [14] (see My Research page to download my Journal club slides on DeepSEA)
• SIFT, PolyPhen-2, and FATHMM via Ensembl VEP – for coding SNPs [15]
6- Enrichment of associations at DNase hypersensitivity sites:
Using your GWAS results to identify chromatin features relevant to your trait of interest can yield important information on the genetic aetiology of that trait (e.g. DNase hypersensitivity site enrichment in fetal lung would mean that developmental pathways in the lung are playing an important role)
• FORGE [17] – very easy to use but superseded by GARFIELD
7- Pathway enrichment analysis:
• ConsensusPathDB [18] – as it queries more biological pathway and gene ontology databases than the alternatives. You can input all the genes that are implicated by eQTL/pQTL databases and variant effect prediction (e.g. genes that harbour a coding variant in the 99% credible set). Good idea to remove genes in the MHC region (e.g. HLA genes) to identify pathways other than the immune system-related ones. Methods can be found here: ConsensusPathDB_methods
• You can also do an additional check to see if the ‘significant’ pathways (e.g. FDR<5%) are mainly due to the implicated genes – as identified by eQTL/pQTL and variant effect prediction (list 1) – or the regions identified by GWAS itself: extract all the genes within 500kb of the sentinel SNPs (list 2) and then make 100 lists (same size as list 1) with genes randomly selected from this set. Then input these to ConsensusPathDB and see how many times the pathways identified by list 1 appears in the output as ‘significant’.
8- LD score regression:
Bivariate LD score regression allows one to identify the genetic correlation between two traits which implies shared biology.
• LD Hub [19] – check the genetic correlation between your trait of interest and up to >600 traits (see My Research page to download my Journal club slides on LD Hub)
• Stratified LD score regression [20] – check if there’s significant enrichment of heritability at variants overlapping histone marks (e.g. H3K4me1, H3K4me3) that are specific to cell lines of interest (e.g. lung-related cell lines for a GWAS of a respiratory disease)
9- Single-variant and genetic risk-score PheWAS (phenome-wide association study):
• GeneAtlas [21] or the UK Biobank Engine [22] for single-variant PheWAS
• PRS Atlas [23] – for polygenic risk score PheWAS (see My Research page to download my Journal club slides on the PRS Atlas)
• Other automated and reliable software include PHESANT
10- Druggability analysis:
Once a list of potentially causal genes is created, one can then query drug/target databases to see whether the respective genes’ products (i.e. protein) are already targeted by certain compounds – or even better, in clinical trials (see ‘Approved Drugs and Clinical Candidates’ section for each protein in ChEMBL – if there is one).
If several proteins within your gene list are predicted/known to interact, this will provide a separate line of evidence for those genes – that is if they’re implicated by different signals/SNPs.
• STRING [26] – a score of >0.9 implies a ‘high-quality’ prediction
12- Literature review:
• A thorough literature review of the identified genes is always a good way to start a story. Download RefSeq_all_gene_summaries for extracted gene function summaries from RefSeq [27]
13- GWAS catalog lookup:
Checking to see if your associated SNPs are also associated with other traits can be important for (i) shared biology and (ii) specificity – can be important for drug target discovery.
• International Mouse Phenotyping Consortium (IMPC) [30] – see (i) if the genes of interest have been knocked out and (ii) what phenotypes were observed in the knockout mice
15- Mendelian randomization analysis:
Although over-hyped in my opinion, when carried out correctly it becomes a very useful tool to assess the causal relationship between an exposure and outcome. You can use your associated SNPs as a proxy for your trait (e.g. LDL cholesterol associated SNPs) and then check to see if your trait causes a disease (e.g. obesity)
• MR-Base [31] – carry out Mendelian randomization studies using your trait of interest as exposure or outcome
Great to see this published today in Molecular Psychiatry. A huge team effort, using data from 60 studies and @uk_biobank, to further our understanding of the biology behind #tobacco#addiction. https://t.co/0sGD3Q40yr
1- Shrine, Guyatt, and Erzurumluoglu et al, 2018. New genetic signals for lung function highlight pathways and pleiotropy, and chronic obstructive pulmonary disease associations across multiple ancestries. Nature Genetics [32]
2- Wain et al, 2017. Genome-wide association analyses for lung function and chronic obstructive pulmonary disease identify new loci and potential druggable targets. Nature Genetics [33]
3- Allen et al, 2017. Genetic variants associated with susceptibility to idiopathic pulmonary fibrosis in people of European ancestry: a genome-wide association study. The Lancet Respiratory Medicine [34] – I like Figure 3 in this paper where they align and plot both the Lung eQTL and IPF GWAS results to visualise whether the causal variant in the eQTL study and GWAS are likely to be the same. However, as mentioned above at point 3 (i.e. eQTL-GWAS signal colocalisation), I would suggest using Z-scores rather than P-values to observe the direction of effects
4- Erzurumluoglu, Liu, and Jackson et al, 2018. Meta-analysis of up to 622,409 individuals identifies 40 novel smoking behaviour associated genetic loci. Molecular Psychiatry [35] – the Circos plot in this paper is brilliant! No competing interests declared 😉
• Erzurumluoglu et al, 2015. Identifying Highly Penetrant Disease Causal Mutations Using Next Generation Sequencing: Guide to Whole Process. BioMed Research International – I recommend this paper for PhD students who are looking for a comprehensive review comparing the ways Mendelian diseases and complex diseases are analysed. It is a little out of date in terms of the software/databases (e.g. The gnomAD database is not in there) that are in the tables but the main messages hold
Download a PDF version of the blog post from here:
Social Media
There’s a little thread under the below tweet, where Dr. Eric Fauman (Pfizer) states “The gene pointed at by an eQTL is actually less likely to be the causal gene”.
An example output from AutoZplotter using whole-exome sequencing data – used to identify the Primary ciliary dyskinesia causal gene, CCDC151, in Alsaadi and Erzurumluoglu et al, 2014 (read this paper’s story here). The green and red dots correspond to heterozygous and homozygous calls (for the alternative allele), respectively. The continuous blue lines correspond to the probability that the observed sequence of genotypes is not autozygous (e.g. close to zero means likely to be an autozygous region). LRoH: Long runs of homozygosity. NB: This image has been edited to ensure confidentiality/anonymity of the participant. Some LRoHs have been shortened or extended for this reason. If you’re thinking of using an AutoZplotter image in a paper, do not share genome-wide figures but maybe consider using chromosome-wide ones
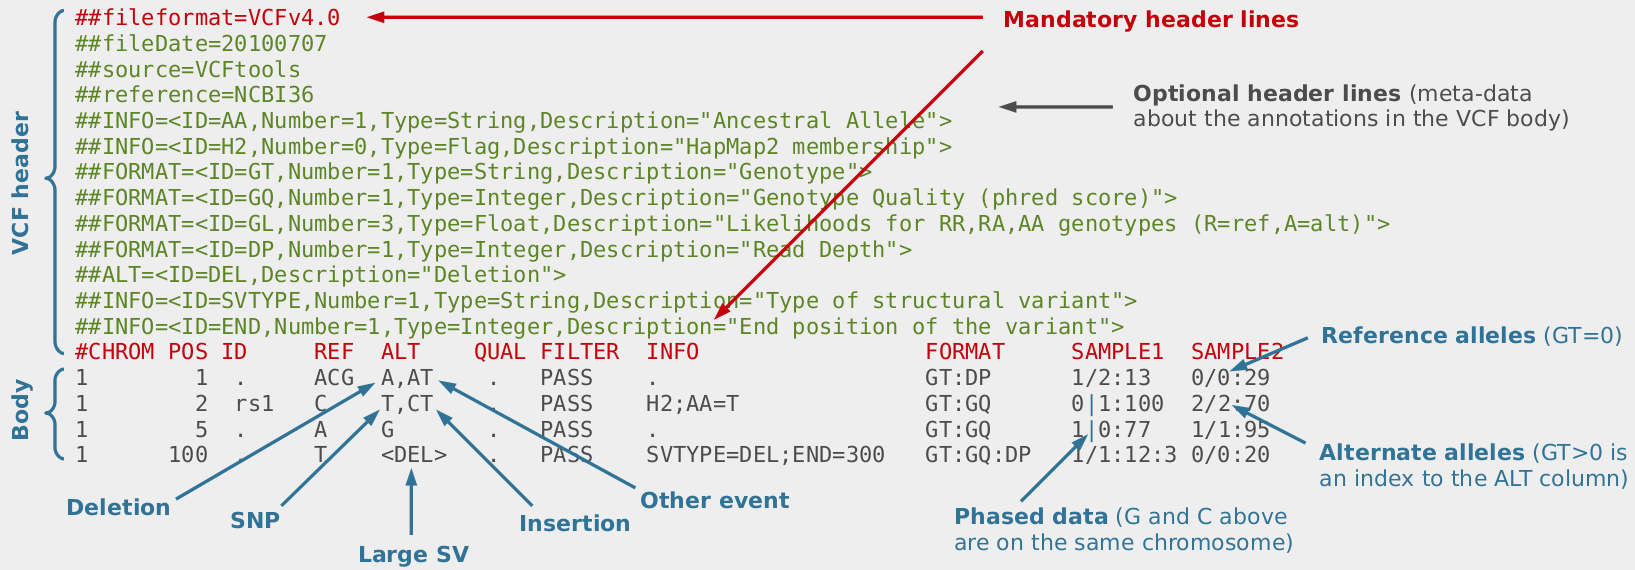
When analysing whole-exome or whole-genome sequencing (or dense SNP chip) data obtained from consanguineous individuals with a rare Mendelian disease, the disease causal mutation usually lies within an autozygous region (characterised by long runs of homozygosity, LRoH, which are generally >5Mb). Thus checking whether any candidate genes overlap with an LRoH can substantially narrow region(s) of interest. There are several tools which can identify LRoHs such as Plink, AutoSNPa and AgilentVariantMapper. However, they all require their own formats and considerable computational knowledge; and also struggle to identify regions that are shorter than 5Mb. Thus, we wrote AutoZplotter, a user-friendly python script which plots the heterozygosity/homozygosity status of variants in a VCF file to allow for quick visualisation and manual identification of regions that have longer stretches of homozygosity than would be expected by chance.
AutoZplotter accepts the VCF format – which is the standard format for storing genetic variation data from NGS platforms. Image Source URL: bioinf.comav.upv.es
The input format of AutoZplotter is VCF, thus it will be suitable for any type of genetic data (e.g. SNP array, WES, WGS) and from any species.
To download latest version of AutoZplotter, click here (directs to ResearchGate). If you found AutoZplotter helpful in anyway, please cite Erzurumluoglu AM et al, 2015.
References:
Erzurumluoglu AM et al, 2015. Identifying Highly Penetrant Disease Causal Mutations Using Next Generation Sequencing: Guide to Whole Process. BioMed Research International. Volume 2015 (2015), Article ID 923491
Alsaadi MM and Erzurumluoglu AM et al, 2014. Nonsense Mutation in Coiled-Coil Domain Containing 151 Gene (CCDC151) Causes Primary Ciliary Dyskinesia. Human Mutation. Volume 35, Issue 12. Pages 1446–1448
Erzurumluoglu AM et al, 2016. Importance of Genetic Studies in Consanguineous Populations for the Characterization of Novel Human Gene Functions. Volume 80, Issue 3. Pages 187–196
Erzurumluoglu AM, 2015. Population and family based studies of Consanguinity: Genetic and Computational approaches. PhD Thesis. University of Bristol
Breathtaking genes: A ‘Circos’ plot depicting how chronic obstructive pulmonary disease (COPD) has become a global concern – the 3rd biggest killer, defined by poor lung function. Our work shows that many parts of our DNA play a role in our lung health. Peaks in red are newly discovered regions, and the blue ones were previously identified by other groups. Millions of genetic variants from tens of thousands of individuals were analysed in this study. The identified genes will help us understand why some of us have better lung function, and lead to the identification of drug targets of potential relevance to COPD.
A press release was issued by the University of Leicester Press Office on 6 February 2017 about a study that I was also heavily involved in (please click on links below for details):
The study has received a lot of attention from the media, with articles appearing in large media outlets such as BBC News, The Independent and MSN News. If you’re interested in the details, please read the paper published in Nature Genetics.
If interested in reading about the area of Genetic Epidemiology itself, please have a look at my (previously published) blog post about the matter: Searching for “Breath taking” genes. Literally!
Details on Circos plot* (above): FEV1: Forced expiratory lung volume in 1 second; FVC: Forced lung volume capacity; FEV1/FVC: the ratio of the two measurements. Labels in the outer circle show the name of the nearest gene to the newly identified (red) variants. X-axis: Genomic position of variant in genome (chromosome number in the outer circle), Y-axis: Statistical significance of variant in this study (higher the peak the greater the significance).
*The figure is a more artistic version of Figure 1 (Manhattan plot) in the above mentioned academic paper. It did not make it into the final manuscript published in Nature Genetics (6th Feb 2017) as it was found to be “confusing” by one of the reviewers – and the editor agreed. 😦 However, the plot was shortlisted (title: Breathtaking genes) and displayed in the Images of Research exhibition (9th Feb 2017) organised by the University of Leicester. 😉
My role in the Wain et al paper mentioned above: I led the ‘functional follow-up’ of the identified associated variants (e.g. mining eQTL datasets, biological pathway analyses, identify druggable genes, pleiotropy, protein-protein interactions) and appropriately visualise the GWAS results (various Manhattan and Circos plots). I was part of the core bioinformatics team of three in Leicester – alongside Dr. Nick Shrine and Dr. Maria Soler-Artigas.
References:
Wain LV et al., Published online 6th Feb 2017. Genome-wide association analyses for lung function and chronic obstructive pulmonary disease identify new loci and potential druggable targets. Nature Genetics. URL: https://www.nature.com/articles/ng.3787
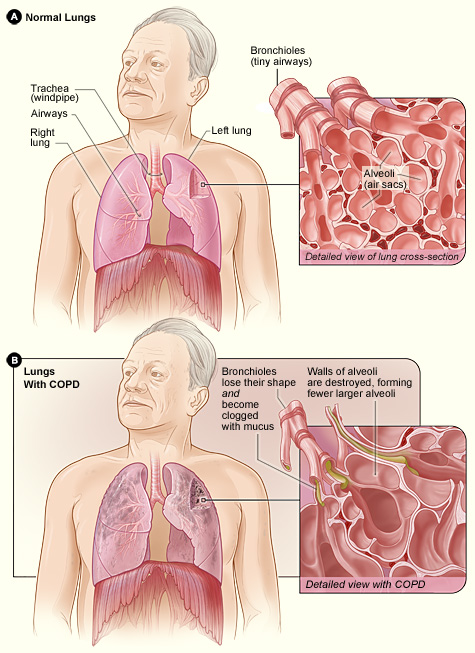
Difference between the lung of a COPD patient and an unaffected one. Image taken from the NHLBI website (one of the leading institutes in providing information on various diseases; click on image to access the source)
Many of us will either suffer or have a relative/friend who suffers from a disease called Chronic Obstructive Pulmonary Disease (COPD, click on link for details) which is a progressive respiratory disease characterised by decreasing lung function (struggling to inhale/exhale air, irreversible airflow obstruction), very likely accompanied by chronic infections. COPD has a prevalence of over 2% in the UK population (corresponding to approx. 1 million in the UK, probably a lower bound estimate due to many undiagnosed cases; this figure is approx. 16 million in the USA) and is currently the third biggest killer in the world (only behind cancers and heart-related diseases) – costing the lives of millions (in the USA alone, number of deaths attributed to COPD is over 100 thousand); and the health services, billions of pounds.
Contrary to the well-known genetic disorders such as Cystic Fibrosis and Huntington’s disease, which are diseases caused entirely by a person’s genetic makeup and caused by mutations in a single gene, COPD is a (very!) complex disease with many genes and environmental factors (e.g. smoking, pollutants) contributing to the development/progression of the disease. This complexity makes it much harder to dissect the causes and find potential (genetic) targets for cures or therapies. However, we do know that smoking is by far the biggest risk factor with up to 90% of those who go on to develop clinically significant COPD being smokers. But only a minority (<25%) of all smokers develop COPD, indicating the strong role genetics can play in the progression of this disorder. Also not all COPD patients are smokers (up to 25% in some populations), indicating that – at least in some patients – genetics can play a rather determining role. I must stress that all the statistics I provide here can vary considerably from population to population due to different lifestyles and genetic backgrounds.
I – together with a large group of collaborators – search for genetic predictors of lung function, which helps us to identify which individuals are more likely to develop the disease and potentially understand the underlying biology/pathology of respiratory diseases such as COPD and asthma, and related traits such as smoking behaviour. To do this, we carry out what is called a genome-wide association study (GWAS, click on link for details), where we obtain the genetic data (millions of data points) from tens of thousands of COPD (or asthma) patients and ‘controls’ (people with normal lung function). To ensure that our results are not biased by different ethnicities, life styles and related individuals, we collect all the relevant information about the participants and make sure that we control for them in the statistical models that we use. GWASs have been extremely successful in the identification of successful targets for other diseases and have led to the field of Genetic Epidemiology (GE, click on link for details) to come to the fore of population-based medicine. GE requires extensive understanding of Statistics (needed to make sense of the very large datasets), Bioinformatics (application of computer software to the management of large biological data), Programming (needed to change data formats, manage very large data), Genetics (needed for interpretation of results) and Epidemiology (branch of medicine which deals with how often diseases occur in different groups of people, and why); thus requires inter-disciplinary collaborations.
GWAS results are traditionally presented with a Manhattan plot (due to its resemblance of the city’s skyline) where the genetic variants corresponding to the dots above the top grey line (representing P-values less than 5e-8 i.e. 0.00000005) are usually followed up with additional studies to validate their plausibility. Image taken from Wikipedia (click on image to access source)
The inferences we make from these studies can shed light in to which genes and biological pathways play key roles in causing COPD. We then follow up these newly identified genes and pathways to analyse whether there are molecules which could be used to target these and be potential drugs for treating COPD patients. Our results can be of immense help to Pharmaceutical companies (and ultimately to patients), as many clinical trials initiated without genetic line of evidence have failed, costing the public and these companies billions of pounds.
As smoking is the biggest risk factor for respiratory diseases like COPD, I am – also with the contribution of many collaborators – in the process of analysing whether some people are more likely to start smoking, stop after starting, and smoke more than usual when they start smoking. The results can have huge implications as many people struggle to stop smoking, and when they do, research suggests that up to 90% (figure differs between populations) of them start to smoke again within the first year after quitting. Smoking is not only a huge contributor to the risk of developing COPD, but also to lung (biggest killer amongst all cancers), mouth, throat, kidney, liver, pancreas, stomach and colon cancer (not an exhaustive list). In the UK alone, these cancers cause the slow and painful death of tens of thousands, alongside a huge psychological and financial burden on the families and public resources.
The “lung” and the short of it (stealing a phrase thought up by my colleagues at the University of Leicester, click on link to see who they are) is that COPD is a disease that is going to affect many of us, and any useful finding which leads to cures and/or therapies could increase the life years of COPD patients and affect the lives of thousands of people directly, and millions indirectly (e.g. families of COPD sufferers, cost to the NHS). Finding targets to help people stop smoking can potentially have even bigger implications as many continue to smoke, despite huge efforts and funding allocated to smoking prevention and cessation.
A nice TED talk about the world of Data science and Genetic Epidemiology
Ben 12 yaşındayken (2000) ailecek İngiltere'ye taşındık ve ingilizcem neredeyse sıfırdı. Bunu duyan (Karen Holman adında) Sınıf Öğretmenim, kendimi evimde hissedeyim diye tüm arkadaşlarıma Türkçe cümleler dağıtmış. Sınıfa girer-girmez arkadaşlarımın hepsi bana "Hoşgeldin" dediler